The CAGE MODEL and the “Innovation Sweet Spot”
Innovation has two main beneficiaries; the internal and external customers for the product, service, or software being developed. When you dig deep, you find these customers have many needs you must satisfy to earn their business. Some of the needs are obvious and some hidden (blatant and latent). To compound the issue, in every case we have seen, there are multiple customers with these needs.
As an example, consider the development of a new medical instrument used for the treatment of cancer or heart disease. Who are the customers?
The external customers: The surgeon, technician, lab assistant, nurse, purchaser, insurance carriers, and the patient are all examples of external customers. Each of them has a set of requirements; some of them overlap and some are unique to that customer segment.
The internal customers: The manufacturing group that is looking for ease of manufacture and assembly, the logistics planners who are concerned with shipping and distribution issues, the purchasing group who want the lowest costs for maximum profits, the intellectual property department that is concerned with licensing potential and competitive advantages, the development team of a higher level assembly is concerned with interface issues and functional performance, etc. Each of these internal customers has a set of their own requirements; some of them overlap and some of them are unique to that customer segment.
Without external customers, internal customers are irrelevant because external customers put money into the value chain. On the other hand, if we only focus only on external customers and violate internal requirements we will also fail. It is important to have a comprehensive understanding of both the external and internal customer requirements to win in our increasingly competitive market.
To accomplish this deep understanding, it is first important to understand why many new products and services fail. Three specific reasons (root causes) most new products and services fail are listed below:
1. Missing value added features or qualities that differentiate your offering from the competition, i.e., Innovation)
2. Lack of understanding of your customer needs (i.e. Their top priorities)
3. Being “too” customer driven, i.e., believing and incorporating everything your customers tell you)
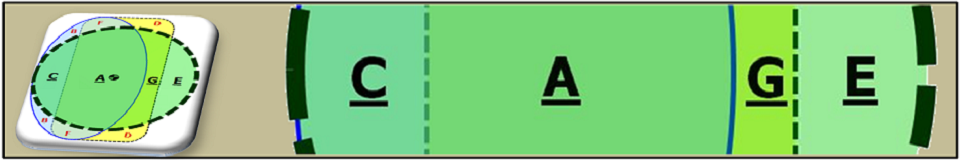
The CAGE Model shown in Figure 1 below illustrates critical elements that must be included and excluded for success in the marketplace. The graphic may look a little confusing at first glance, but is actually quite illuminating of the reality found with most development teams. In the below explanation, we will take you through a clear description of what the three main regions represent as well as a specific description on each of the “A-G” sub-regions that need to be understood for success.
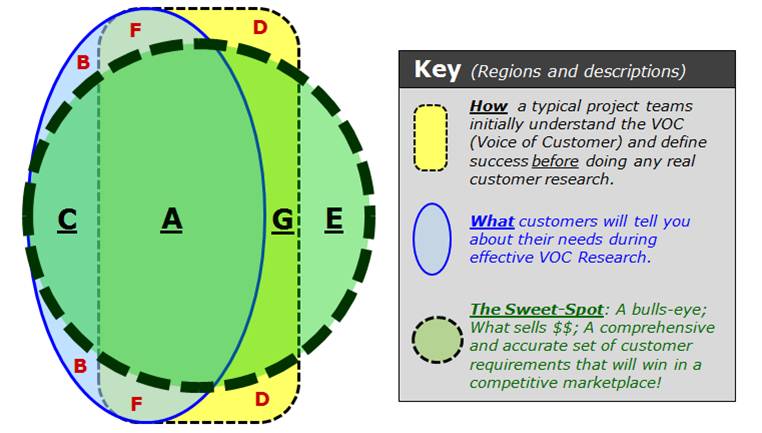
Figure 1 – The CAGE Model Key
The CAGE Model shows three distinct “knowledge universes” that typically occur in the beginning stages of new product, service, or software development. Below the three universes, or regions, are explained in detail:
Region #1 (Yellow: Thin dashed rectangular line) represents how project teams initially understand the customer’s requirements and define success before doing any real customer or market research.
Note: Believe it or not, many product development teams stop here. They never formally talk to their customers to better understand their needs.
Region #2 (Blue: Solid thin oval line) represents what customers will tell you about their needs during typical VOC Research. Note: Customers are generally not very effective at articulating all their needs.
Region #3 (Green: Bold dashed circle) represents the team’s ultimate requirements goal. It’s the bulls-eye, the Innovation sweet-spot, a comprehensive and accurate set of requirements that will win in a competitive marketplace! Note: What we are suggesting here is that even classic VOC research techniques (Region #2) are not enough to hit the bulls-eye, the Innovation sweet-spot.
This model shows why many project teams fail to hit the Innovation sweet-spot. Note there are several distinct and unique areas labeled in (and outside) the sweet-spot bulls eye. Since our goal is Region #3, the bulls-eye, we must understand and document the four elements (C, A, G, and E) and make sure we minimize or eliminate the elements (B, F, and D) outside it. An explanation for each of these regions is described below, starting with the elements outside the bulls-eye, the items you don’t want.
Area D is straight forward. It represents what the project team simply got wrong! Customers don’t want these. Too much of one thing, not enough of the other, wrong feature or feature set, an engineer’s pet project, and so on. We all know this happens and there are many things that cause it, most of them are preventable.
Area B might be a bit surprising to some, but it represents what the customers get wrong! Sometimes they ask for more than they are willing to pay for or they ask for solutions that don’t really address their “real needs.” We must recognize and eliminate these in advance.
Area F represents requirements the project team and customer got wrong! Yes, this is rare, but sometimes they both get it wrong!
Since areas D, B, and F are regions we don’t want in our offerings, let’s focus on the elements we do want. (i.e. The C, A, G, and E elements).
Area C represents important Customer Insights the project team will discover during effective VOC research. Through questioning and observational techniques a few golden nuggets often surface.
Area A (in the center) represents requirements that All agree upon! The development team was aware of them before customer research, the customer verified them during the research, and they are the things customers will consciously look for when evaluating options and purchasing.
Area G represents the Givens, – These are needs or requirements customers won’t tell you about because they “go without saying,” they are expected, assumed, or obvious – For example, when buying a computer, they don’t ask for a power plug. When making reservations at a hotel, no-one will ask for a window in the room or a reliable lock on the door, but if either are missing, customers will likely be quite upset and never come back to that hotel.
And finally, Area E represents the “Excitement” Quality, these are the gold nuggets, the Innovations, the “WOWs” customers won’t tell you about these because they don’t know about them, yet!! These Innovations will differentiate your offering, give you a competitive edge, increasing your market share, and allow for higher profit margins. To get Area E, we leverage the over three dozen idea generation and problem solving tools utilized in step 4 of the 8-Step Systematic Innovation Process. To discover several tools, skills, and strategies to come up with “Excitement Quality” check out our sister site www.InnovationTutorials.com. That site is devoted to Innovation and Inventive Thinking.
The main point of the CAGE Model is to clearly illustrate the risk in a weak set of requirements and the importance of going beyond the VOC for truly innovative offerings. Many project teams assume they already know their customers’ needs, far better than assuming, is effective VOC research to capture missing insights, and even better than that, especially in a competitive landscape, is combining modern VOC efforts with modern “Systematic Innovation” tools to get as close as possible to the “CAGE bulls-eye” shown in this model.

October 5th, 2015 at 10:40 pm
No comments yet, come on people! 😉